Over-enthusiasm
Link

- The much sharper-than-expected deceleration in US job creation in April provided strong support for all assets at the end of the week. In particular, the US stock market went into overdrive, with the S&P 500 up over 1% and the Nasdaq gaining almost 2%, on early expectations that the Fed might adopt a more accommodating policy sooner. This was also reflected in the sharp fall in long-term yields. The US 10-year yield lost almost 8 basis points (bp).
- We should certainly be prepared for abrupt market movements in the months ahead. Indeed, the U.S. economic slowdown we're predicting is likely to have its ups and downs, while inflation, too, will not follow a linear path. What is certain, however, is that the Fed has already given us its modus operandi. Caution will prevail. One number will not be enough to change its policy.
- Job creation, at 175,000, was well below expectations (+240,000 jobs) for the first time since the start of the year. While this is encouraging in terms of reducing tensions on the job market, it is not enough. Moreover, the drop is explained by an abrupt disappearance of new jobs in the public sector. We'll have to wait and see whether we've finally entered a cooling phase in the labor market.
- The very slight rise in the unemployment rate, coming from the household survey, to 3.9%, reflects a stronger flow of entrants into the labor market than job creations. This is positive. In addition, the moderation in wage growth over the month is also good news, but year-on-year we're still at 3.9%, a level incompatible with the Fed's 2% inflation target.
- The moderation in job creation was also echoed in the release of the ISM services survey for April. This came out weaker than expected, at 49.4, i.e. in contraction territory and at its lowest since the end of 2022. With the manufacturing index also showing a contraction, it looks like a weak start to Q2 24 in terms of growth. At the same time, cost pressures have picked up sharply according to the survey, giving a sign of caution on inflation.
- In the Eurozone, while we seem to be seeing some progress on wage deceleration, we also need to be cautious about how quickly inflation slows down. Indeed, for the time being, we continue to see labor markets that are holding up well, which could reduce the speed of wage inflation deceleration. In March, the unemployment rate in the zone remained close to historic lows at 6.5%.
- In China, April services activity came in as expected, at 52.5, slightly down on the previous month, but still in expansion territory. This is consistent with growth that should hold, but gradually slow over the course of the year in the absence of stronger public stimulus.
- All these statistics underline the difficulty we'll have in navigating the macroeconomic framework in the months ahead. Our scenario nevertheless retains the idea of Fed and ECB rate cuts, albeit more pronounced in Europe. We therefore continue to recommend a high degree of diversification between asset classes in our allocations, with a preference for portage in the bond world, with exposure to quality credit, and in equities, with a preference for Europe.
In the United States, the employment report for April came in weaker than expected. The business survey showed that 167,000 jobs had been created, whereas 240,000 had been expected. At the same time, the unemployment rate rose, albeit slightly, to 3.9%, the level reached in February.
Unemployment remains historically low, but the trend appears to be upwards. The upward trend remains moderate, and last month was again due to more people entering the job market than the number of jobs created over the month. Indeed, the participation rate of the largest category, the 25-54 year-olds, is at its highest for over 20 years.
Fig.1 United States: Unemployment rate rises to 3.9% in April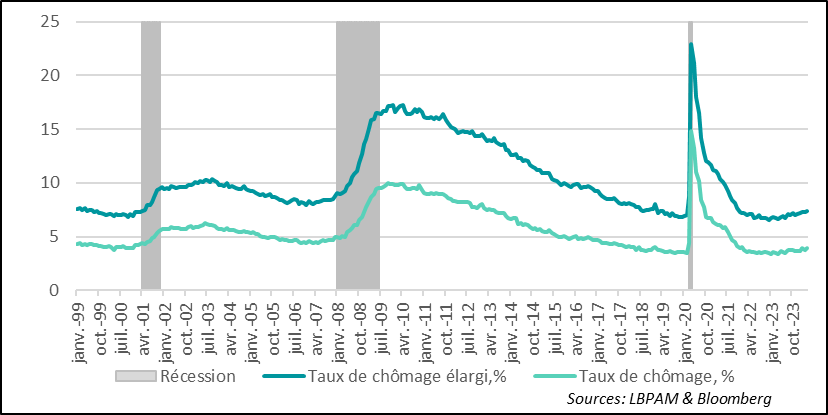
- Recession
- Unemployment rate, %, extended
-Unemployment rate, %
In fact, once again, over the month, there is a big difference between job creations as identified by the household and business surveys. While the business survey estimates the number of jobs created in April at 175,000, the household survey lists only 25,000. However, this is largely due to methodological differences. However, even when these are corrected, as the US Bureau of Statistics does, major differences persist.
All in all, however, both surveys show that, over the month, the economy created jobs. The household survey, which determines the unemployment rate, shows that 25,000 jobs were created, which should be compared with the arrival of over 67,000 new entrants to the job market, hence the rise in the unemployment rate.
Fig.2 USA: major differences persist between household and business employment surveys, but both show continued job creation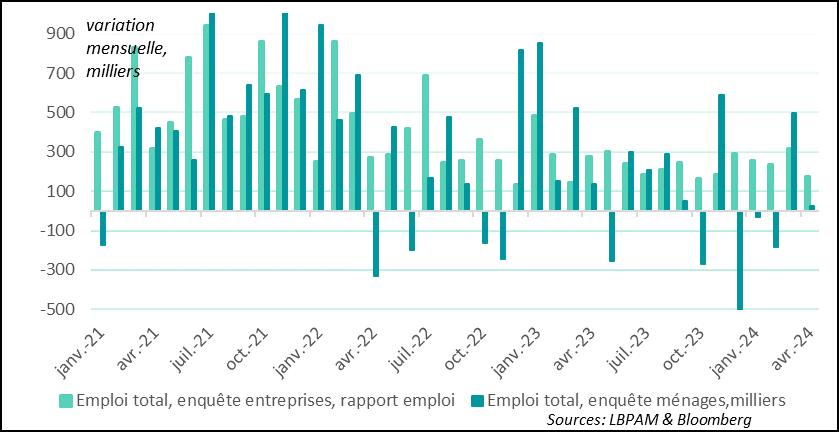
-Total employment, company survey, employment report
-Total employment, household survey, thousands
At the same time, as mentioned above, the total number of new jobs estimated by the business survey came in at 175,000, and 167,000 for the private sector. Both figures were below consensus expectations.
Nevertheless, for the private sector, the difference with the average of the last 6 months (180,000) is relatively small. In fact, the diffusion index published by the Bureau of Statistics, which calculates the dynamism of job creation in the various sectors, rose over the month, showing that a significant number of sectors are continuing to add jobs.
One of the report's big surprises was the collapse in job creation in the public sector, particularly in local government. Thus, from an average of almost 36,000 jobs created per month over the last 6 months, we have gone to 0. It's hard to say at this stage whether this is a trend. Nevertheless, we might have expected a lull after the massive hiring to compensate for the very sharp job cuts during the Covid period.
Fig.3 United States: local governments put an abrupt halt to hiring in April
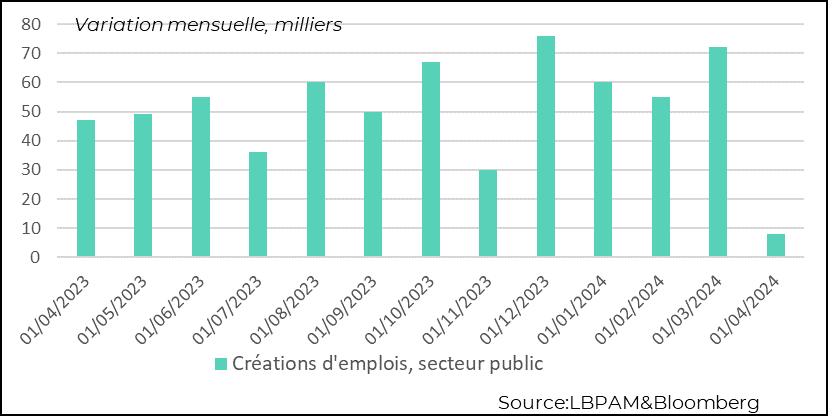
- Job creation, public sector
At the same time as job creation moderated in April, hourly wage growth also slowed from the previous month's acceleration to 0.2%. Over the last three months, there has been a clear slowdown in wages, but it is still too early to say that wage pressures are disappearing.
Indeed, even if the year-on-year trend is reassuring, wage growth remains at 3.9%, a figure still incompatible with inflation converging towards the Fed's 2% target. Moreover, as we all know, the employment survey statistic is less reliable than others, in that it carries major compositional biases. We'll have to wait until next week for a more reliable indication with the publication of the Atlanta Fed's estimates on wage growth.
In any case, this gradual slowdown in wage pressures, if confirmed, is in line with our scenario, which should enable the Fed to start cutting rates in September, albeit gradually.
Fig.4 United States: PCE confirms slow deceleration in US inflation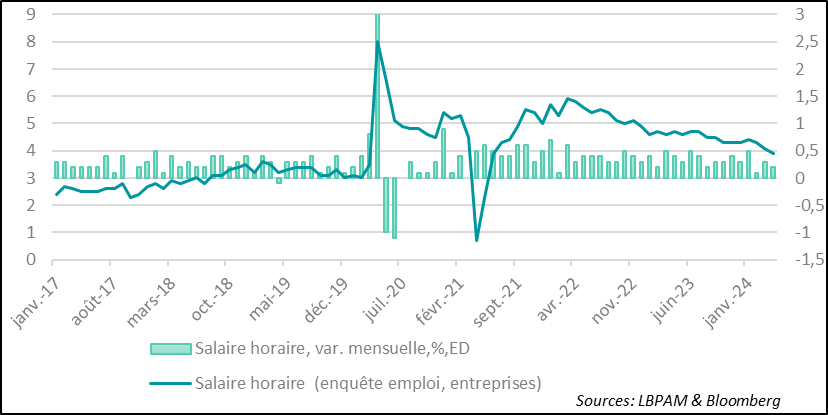
- Hourly wage, monthly var., %, ED
- Hourly wages (employment survey, companies)
The ISM survey on the state of activity in the services sector nevertheless cast a pall over growth momentum. Indeed, for the first time since the end of 2022, this services activity index has moved into contraction territory.
The main reason for this slowdown was the sharp drop in job creation in April. At the same time, new orders, which are still growing, also slowed over the month.
While the ISM index for the manufacturing sector also moved back into contraction territory, this contraction in services activity seems to indicate that growth is losing a little speed at the start of Q2 24. Nevertheless, this remains consistent with our scenario of a gradual slowdown in activity over the course of the year.
The bad news from the survey was also the sharp rise in costs. Indeed, the index of prices paid by companies in the sector rebounded sharply. This is another sign that calls for caution in terms of inflation dynamics across the Atlantic.
Fig.5 United States: Services activity slips into contraction territory for the first time since late 2022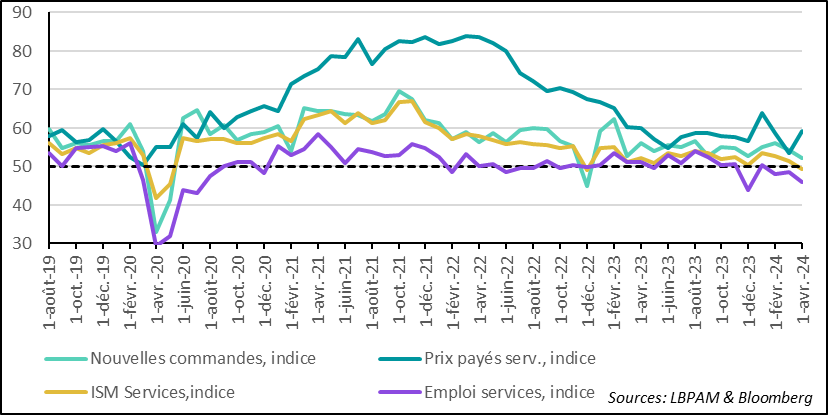
- New orders, index
-Prices paid serv, index
-ISM Services index
-Employment services, index
One of the surprising features of the economic cycle in the major developed countries is the persistence of low unemployment rates.
This has so far kept pressure on wages in the Eurozone, despite weak economic growth. In March, the unemployment rate in the Eurozone stood at 6.5%, close to historic lows.
Wages do appear to be on the way down, but this process may be slower than expected, keeping pressure on business costs, particularly in the services sector. This may explain the persistence of relatively high inflation in this important segment of the economy.
As we know, for the ECB, the slowdown in wages is an important factor in loosening the stranglehold monetary policy currently exerts on the economy. Nevertheless, at this stage, the cut in key rates scheduled for June remains on course.
Fig.6 Euro zone: March unemployment rate remains close to historic lows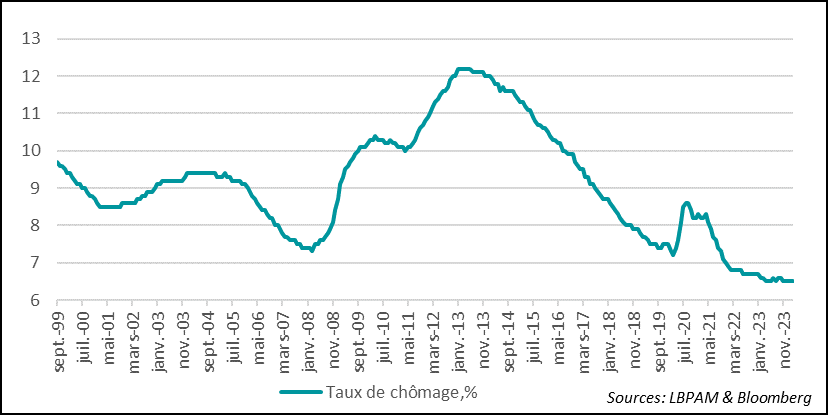
- Unemployment rate, %
In China, the S&P (Caxin) PMI services survey for April came out as expected, with an index of 52.5, slightly down on the previous month. With activity in the manufacturing sector also expanding, we can see that growth in the Chinese economy is continuing at a moderate pace.
We still expect growth to moderate over the course of the year in the absence of stronger stimulus from the authorities. What will also be crucial to see is whether growth becomes less concentrated on public investment and finds a relay in consumption, which is still very moderate, while the real estate engine is still stalled.
Fig.7 China: Growth continues at a moderate pace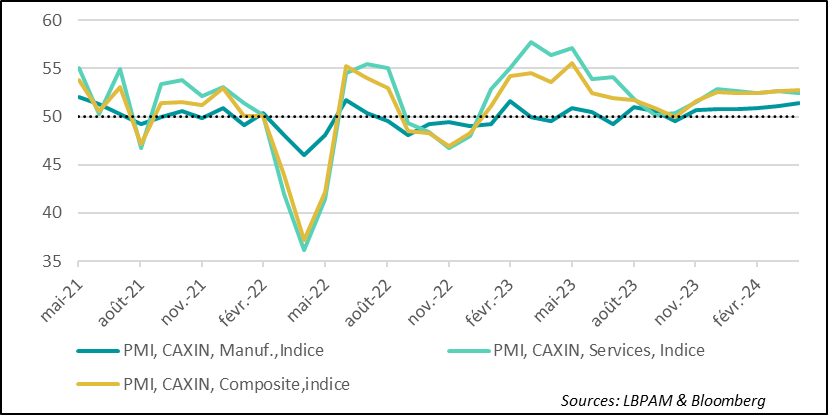
- PMI, CAXIN, Manuf, index
- PMI, CAXIN, Services, index
-PMI, CAXIN, Composite, Index