The gamble of a drastic monetary policy reversal in 2024
Link

- The bond market has continued its incredible momentum since the end of October, with very sharp declines in interest rates. These have been fuelled in part by good inflation figures and central bankers' comments, which are being interpreted as less harsh. As a result, expectations of interest rate cuts are now seen as closer and stronger in 2024, on both sides of the Atlantic. This translates into a massive decline in real rates across all maturities. The prospect of less restrictive monetary policies is also fuelling risk-taking. But the scenario the market is "playing" does not seem trivial.
- Of course, we'd like to believe in a scenario where inflation declines "nicely" and growth holds up, and even accelerates in 2024. However, prudence dictates that we take into account the possibility of a much more tortuous path. In particular, a more resilient US economy could keep inflation higher, or the necessary adjustment in the economy could be more severe than anticipated. We continue to lean towards a sharper deceleration in the quarters ahead.
- The bond market seems over-confident and no longer incorporates these uncertainties, particularly in the US. The term premium that had returned to positive territory has now disappeared. Given our scenario, we expected long rates to fall from their peaks. However, the very sharp recent fall seems to us to indicate an anticipation of a much steeper-than-expected landing, unless it is simply the prospect of key rates being cut in response to a faster decline in inflation. The faster decline in short rates relative to long rates is compatible with both these alternatives. Nonetheless, the easing of financial conditions that has meant lower rates and rising equities in recent weeks could complicate the task of central bankers.
-
In terms of the direction of the economic cycle, the global manufacturing sector continued to contract in November. Indeed, JP Morgan's global indicator, using S&P PMI survey data, remains in contraction territory. Nevertheless, it is no longer deteriorating. This is good news, even if it's hard to see what factors might cause it to pick up again. In the November surveys, Europe and the United States stood out for the fact that companies were starting to reduce employment more markedly. At the same time, price trends continued to moderate, which should be supported by the recent fall in oil prices.
- We will have the services PMIs this week for most countries, which should not only give us an indication of activity, but also of the inflation dynamic as seen by companies, notably due to wage pressure. In the United States, the employment report for November will also be very important in terms of the pace of moderation in the labor market.
The bond market continued to sharply lower central bank interest rates in both the US and Europe. The acceleration of these downward expectations was fuelled by better inflation figures published last week on both sides of the Atlantic, but also by the market's interpretation of central bankers' comments.
Fed Chairman Jay Powell tried, albeit unsuccessfully, to dampen the market's appetite for rate cuts next year, indicating that the US economy was not yet showing signs of slowing sufficiently to start talking about rate cuts.
At the same time, Mr. Villeroy de Galhau, Governor of the Banque de France, stressed that it was premature to talk about rate cuts in the Eurozone, although a discussion on the subject should take place during 2024. This was enough to reinforce expectations of an easing of monetary policy next year.
All in all, downside expectations gained considerable ground. In the US, we have seen a drop of over 90 points in expectations for early 2025 since the high point of October 18.
Fig.1 United States: Expectations for the Fed's key interest rate in early 2025 continue to fall. Over 90 basis points since October 18.
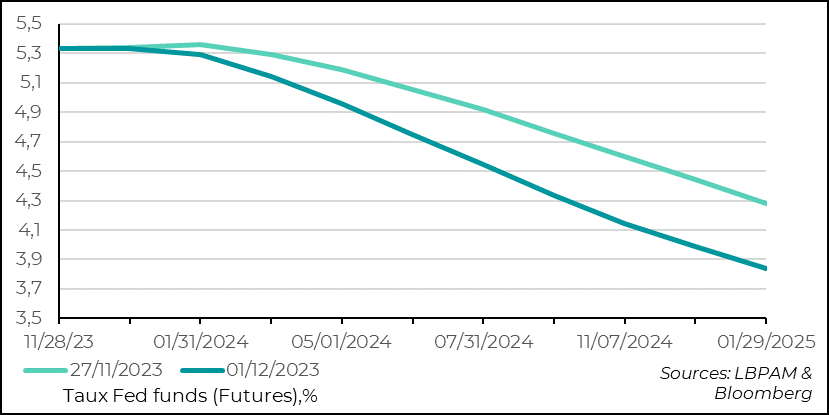
-Fed funds rates (futures), %.
These declines were reflected across the entire yield curve. But of course, the focus was on the long end of the curve, given that US 10-year yields had reached 5% around October 20. As a result, 10-year yields fell below 4.2% on Friday. Since then, a slight correction has taken place.
This movement is mainly due to the fall in real rates. It would appear that the market no longer believes that the Fed will have to maintain a restrictive monetary policy for much longer. This could mean either that inflationary pressures will dissipate "on their own", or that the economy is likely to suffer more than anticipated. At this stage, there is little evidence on either hypothesis.
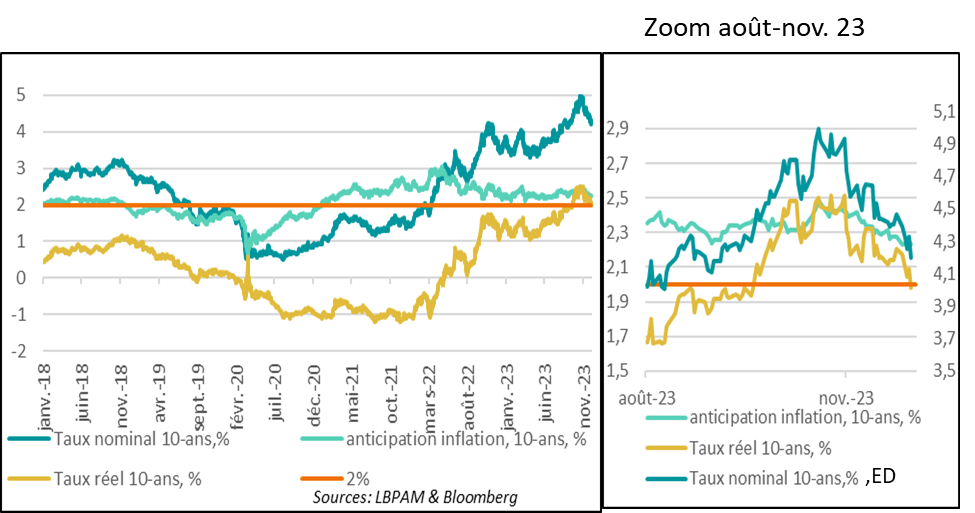
-10-year nominal rate, %.
-10-year real rate, %.
-Inflation forecast, 10-year, %.
-2%
-Inflation forecast, 10 years, %.
-10-year real rate, %.
-10-year nominal rate, %, ED
In fact, one of the remarkable factors in recent developments, particularly in the United States, has been the renewed fall in the term premium. In other words, the premium that investors demand to hold a bond with a long maturity. This premium is not observable, but there are several estimates proposed by the Fed to try and estimate it.
This summer, we saw a rapid rise in the premium, which could easily be explained by the uncertainties surrounding the trajectory of the US economy and therefore of monetary policy, compounded by the endless swelling of public debt. Apparently, in the space of a month, these uncertainties have disappeared! Obviously, this is unlikely. Public debt issuance in the US remains historically high. But this underlines the incredible turnaround in market sentiment we have just witnessed.
Fig.3 United States: Rising public deficits and uncertainties over the path of monetary policy had pushed up the term premium...since erased.
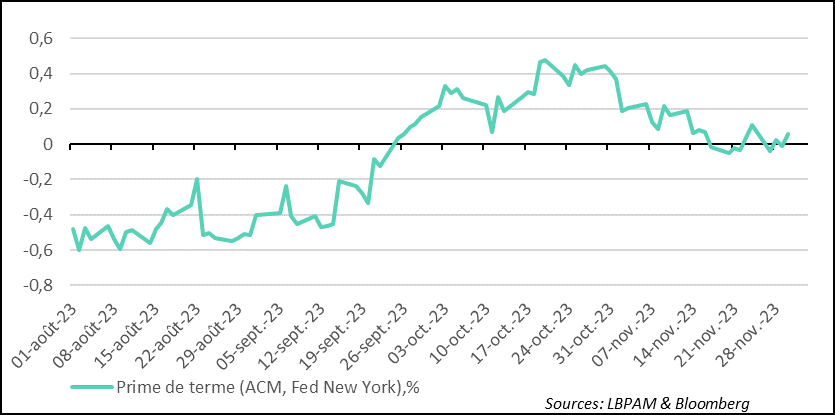
-Term premium (AXM, Fed New York), %
Nevertheless, let's not forget that long rates in the US remain at their highest for the year, even though the 10-year rate has lost almost 80 basis points from its peak.
In fact, these major movements in interest rates have also changed the term structure of the yield curves. In the United States, in particular, we can see that with the more pronounced fall in the shorter parts compared with the longer, the curve has become inverted. In fact, even though rates on the shorter end of the curve remain higher than those on the longer end, the gap between them has narrowed considerably.
If we want to make use of the forecasting capacity attributed to the yield curve over the economic cycle, we often find this phenomenon in the United States, after an inversion of the curve, when the economy goes into recession. Obviously, this is not yet the case, but it is a cause for concern.
In this sense, the statistics of the coming months will be crucial in determining the type of slowdown the US economy is undergoing.
Of course, it is also possible that this heralds a rebound in the economy, and that the curve is gradually moving towards a normal structure (a positive spread between long and short rates). But this hypothesis is even more difficult to envisage at this stage, even if the recent improvement in financial conditions (lower rates, higher equities and a weaker dollar) could provide support for the economy.
Fig.4 United States: The yield curve, while remaining inverted, becomes steeper
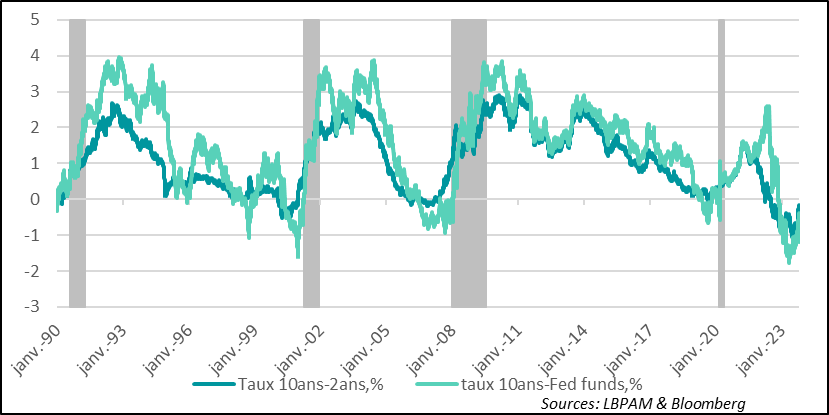
-Rate 10 years-2 years, %.
10-year yield-Fed funds, %.
Manufacturing PMIs for November confirmed that activity in the sector continues to contract. Nevertheless, there are signs of stabilization. Indeed, JP Morgan's global indicator, which is based on all PMIs collected by S&P and ISM, remains in contraction territory, below 50, but in most regions signs of stabilization are appearing.
In fact, the overall index benefited from the rebound in activity in China (even if the official indicator fell) and from a contraction that moderated markedly in Germany. In the United States, the index stagnated in contraction territory.
Fig.5 Manufacturing activity: still contracting, but signs of stabilization emerging
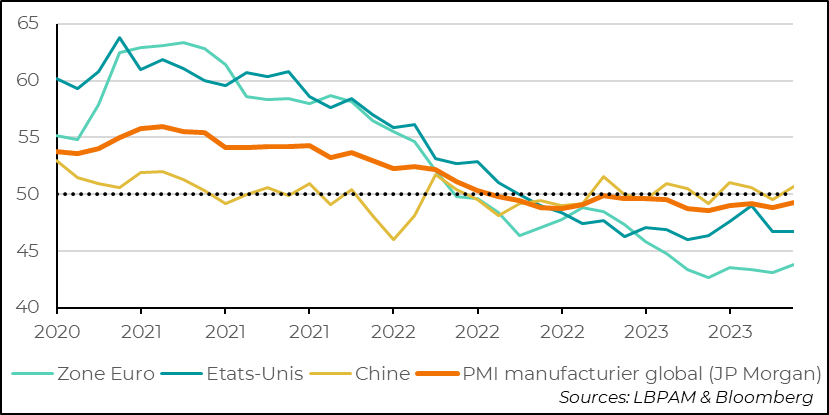
-Euro zone
-United States
-China
-Global manufacturing PMI (JP Morgan)
In the Eurozone, the good news came from Germany. Although the activity index remains in negative territory, it is moving away from the very low levels seen at the start of the summer. By contrast, the situation in France and Italy remains very poor, with few signs of improvement.
Fig.6 Eurozone: Manufacturing activity still contracting sharply, but thanks to Germany, the situation is deteriorating less sharply
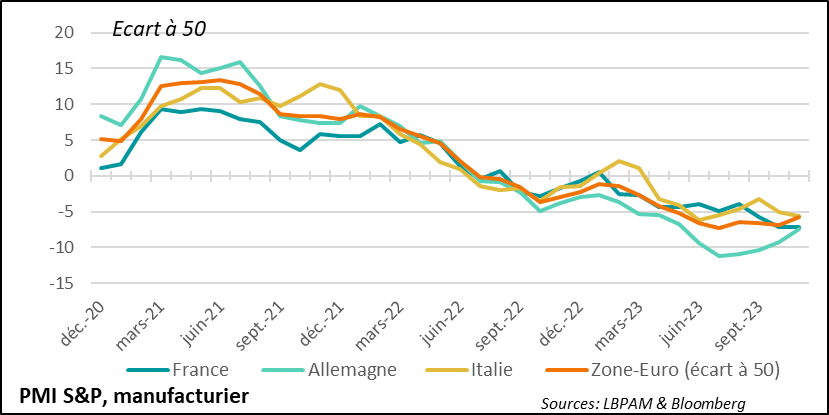
-S&P PMI, manufacturing
In the United States, business activity is still contracting, but the rate of contraction is stabilizing. The indicator remained stable in October, at 46.7. The good news came from new orders, whose rate of contraction eased. However, for the economy as a whole, the message was less upbeat, with comments spreading about corporate downsizing.
Fig.7 United States: Activity is still contracting, but stabilizing at a low level. At the same time, companies seem more inclined to cut jobs.
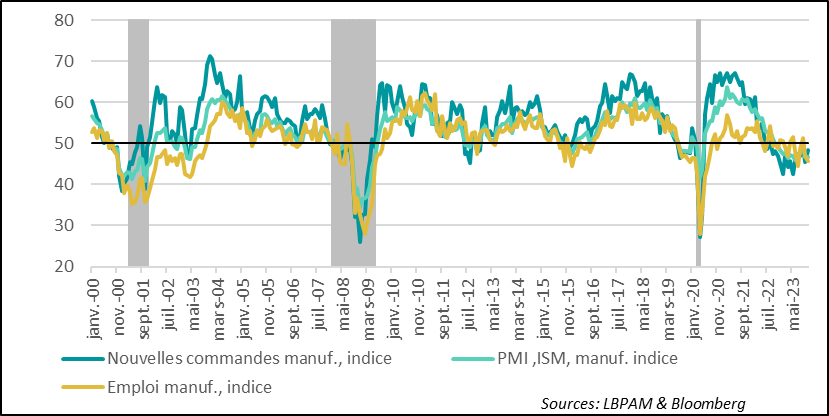
-New manuf orders, index
-Employment index
-PMI, ISM, manuf, index
One piece of good news from the survey is that price pressures continue to dissipate, albeit to a lesser extent across the Atlantic. This should continue in this phase of contracting activity, especially as oil prices fall.