The market gets excited about key rate cuts
Link

-
Since last October, the market has been radically revising its expectations of rate cuts. Fed Chairman J. Powell partially validated the fact that rate cuts would take place in 2024. But these forecasts are becoming increasingly aggressive. A steeper-than-expected fall in commodity prices has fuelled another bearish wave. The market is anticipating more than 6 rate cuts, compared with 3 for the Fed. We expect 4.
-
The market's reaction to the sharper fall in producer prices in December is more than a little paradoxical. Firstly, the link between consumer prices and producer prices is very tenuous. Above all, the Fed will not be guiding its policy on the basis of changes in producer prices. This movement gives the impression, as it sometimes does, that the market is "over-buying" good news. The risk of a correction could be considerable.
-
Above all, for US monetary policy, the aggressive easing of rates driven by the market, while the stock market resists, has the effect of easing financial conditions and stimulating demand and hence growth. In other words, the opposite of the Fed's strategy, which seeks a soft landing.
-
Potentially further complicating the Fed's strategy is the possibility of public spending remaining too stimulative. In this sense, we can wonder about the agreement that seems to be close between Republicans and Democrats to extend expiring corporate tax cuts and child tax credits. A transfer of $70 billion to stimulate the economy, if ever agreed.
-
In Taiwan, the ruling DPP party has won the presidential elections. Lai Ching-Te will be the new president. This result runs counter to China's hopes. The DPP is seen as pro-independence. Nevertheless, the DPP is unlikely to win a majority in parliament and will therefore have to make concessions to the other two major political forces, seen as more pro-unification. In this sense, we can expect a status quo position that avoids creating further tensions. Which would be good news.
Expectations of a Fed rate cut intensified last week. This time, it was the fall in producer prices (PPI) in December that was behind the adjustment. Indeed, final demand PPI fell by -0.1% over the month, whereas it was expected to rise. The core PPI, which excludes the most volatile items, food and energy, also stagnated, whereas it was expected to rise. Year-on-year, the core PPI fell to 1.8%, its lowest level since the end of 2020.This fall in PPI contrasted with the CPI, which had risen more than expected and was still showing a slow deceleration in inflation.
As it happens, taking the PPI as an indicator of inflation is simply wrong. Not only is it not really a leading indicator of CPI, but above all it is not, and should not be, the measure that guides monetary policy decisions.
Obviously, there is a link between the two price indices, but the differences are significant in terms of coverage, classification of goods and services taken into account, or simply by the technical elements, including the calculation method used. For example, the PPI does not include import prices, taxes or margins on the sale of a product.
Above all, these price indicators have very different objectives. The aim of the PPI is to obtain a real value of the value of domestic production, using it to deflate income from production. The CPI, as we know, is used to adjust household expenditure and income to keep pace with the cost of living. Obviously, this is the measure that, from a macroeconomic point of view, the Fed should be following and which is its objective. In fact, the Fed follows a similar but in some ways different measure to CPI, which is the consumption deflator, PCE.
But what's really important to remember is that the relationship between PPI and CPI is not always very strong, and above all that PPI is not really an anticipated indicator of inflation!
In addition to the high volatility of PPI, over the last 10 years alone we can see that there is a link, but not really one of cause and effect.
Fig.1 United States: The PPI is not an early indicator of inflation and is not and should not be the measure followed by the Fed.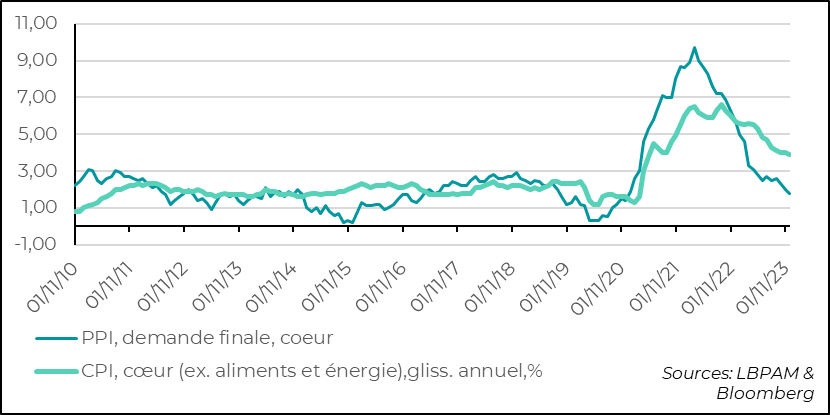
-PPI, final demand, heart
-CPI, core (e.g., food and energy), annual, % change
On the other hand, PPI is an important indicator for tracking the dynamics of real corporate revenues and is useful, from a macroeconomic point of view, for estimating the real evolution of domestic producers' profits. It can also be useful for tracking specific shocks to production prices, such as a rise in commodity prices.
Thus, the market's reaction to the PPI figure seems extremely exaggerated and difficult to understand. The PPI in no way tells us that the disinflation dynamic is faster, and would erase the different message from the CPI, which indicated that it was slow, particularly in services. Nevertheless, it does point in the direction of further price deceleration.
However, this figure has triggered a very strong movement on expectations of rate cuts. The market has thus attributed surprising importance to the PPI.
The market is now expecting more than 6 Fed rate cuts between now and the end of the year, with a strong probability of a cut as early as March. As a reminder, the median forecast of the members of the Monetary Policy Committee is 4.6% for the key rate at the end of the year. For our part, we are maintaining our projection of 4 rate cuts, with the first at the end of 2Q, assuming that the economy continues to slow.
Fig.2 United States: PPI triggers a sharp downward adjustment in expectations of key rate cuts
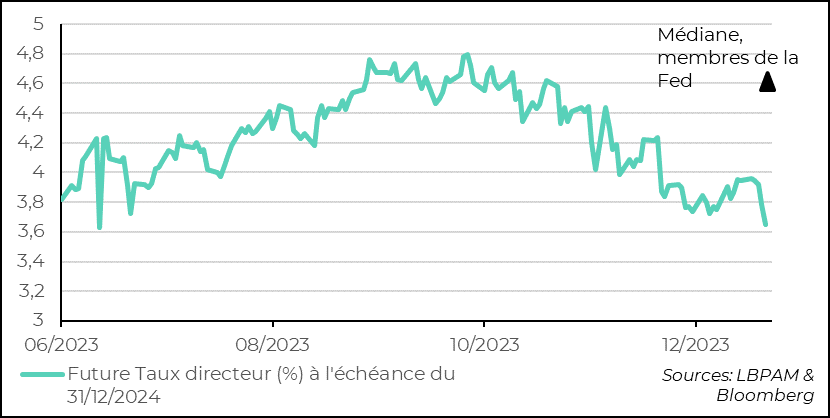
-Future Key rate (%) at maturity on 12/31/2024
Naturally, this fall in expectations of key rate cuts was transmitted directly to the US sovereign curve as a whole, with the short end of the curve falling sharply in anticipation of a key rate cut as early as March.
Fig.3 United States: Yields fall across the US sovereign curve, especially on the short end
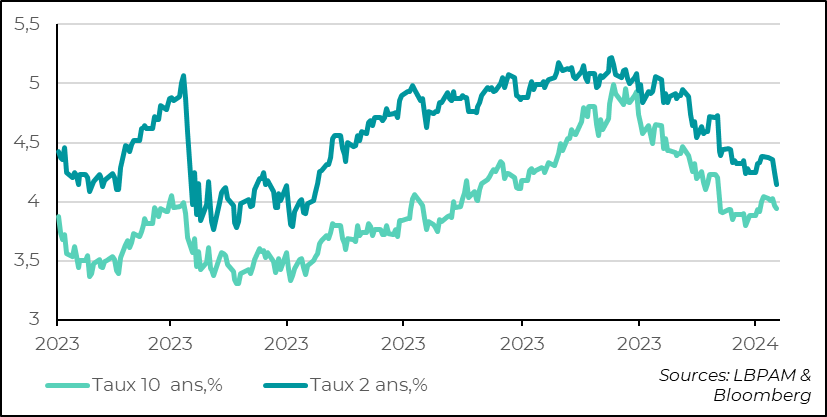
-10-year interest rate, %
-2-year interest rate, %.
This movement seems to us to be really exaggerated, and seems to reflect a dynamic that has taken hold in the market, where the interpretation of economic data only goes in one direction. This should be corrected.
In fact, the result of this decline in rates across all maturities is that financial conditions remain far more accommodative than the Fed would surely like. Some members of the Monetary Policy Committee have already raised this issue, expressing concern that overly accommodative financial conditions could stimulate demand and run counter to the central bankers' objective of a soft landing for the economy. Indeed, a rapid rebound in demand could keep inflationary pressures alive.
Fig.4 United States: Financial conditions remain accommodating, creating the risk of boosting demand
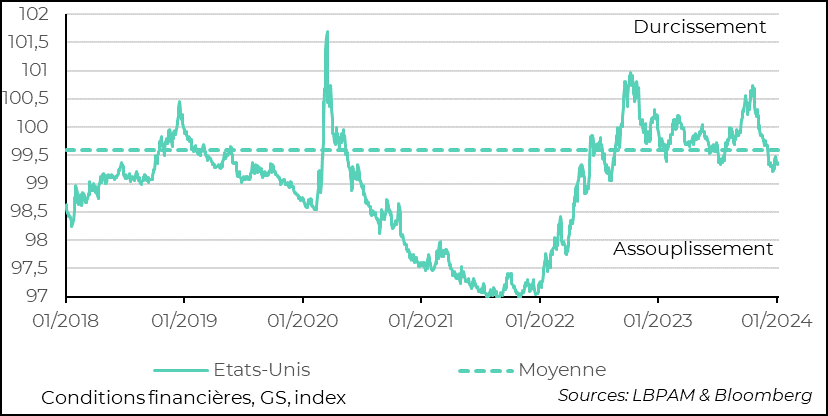
-Financial conditions, GS, index
These market adjustments to monetary policy in the United States obviously had an impact around the world, particularly in Europe. Interest rates also fell sharply, boosting the stock markets.