US consumer resilient despite historic rise in long rates
Link

-
The second stage of Israel's response to the October 7 attacks has begun, according to Prime Minister Netanyahu, with the entry of troops and tanks into Gaza. The market is reacting rather well, as this response is more cautious than initially announced, and also because a meeting between Presidents Biden and Xi could take place in November. Oil remains below $90 a barrel, gold and the dollar are consolidating a little and stock futures are stable this morning. Nevertheless, Israel's response is likely to take time, and the risk of the conflict spreading remains. We therefore expect a certain risk premium to persist over the coming weeks, preventing oil and the dollar from falling further in the short term.
-
Receding risk aversion continues to push US long rates higher. As we approach the end of October, US 10-year yields are up for the 6th month in a row, and by more than 145bp cumulatively over the period. This is a very rare development over the last 60 years, which has led to a historic tightening of financial conditions. What's more, 10-year yields are approaching the 2-year rate, which stabilized in October after remaining well below it since mid-2022. Yet the disinversion of the slope of the US yield curve is historically a reliable indicator of the arrival of a recession, even when it is due to rising long rates (and not falling short rates).
-
Despite these negative signs for the US economic outlook, the latest data continue to indicate that the US economy remains buoyant and that, while inflation is slowing overall, inflationary pressures remain too strong to hope for a rapid return to the 2% mark. Indeed, household consumption rose by 0.4% in September and the core consumer price deflator, the Fed's preferred measure of inflation, reaccelerated to 0.3% (or 3.6% annualized).
-
All in all, US growth should remain positive in Q4, given the momentum of activity at the start of the quarter. But we still expect growth to slow fairly sharply at the end of 2023/beginning of 2024, due to tighter financial conditions since the summer, as fiscal support and household savings decline. Against this backdrop, the Fed is likely to hold rates steady this week, but leave the door open for a final rate hike in late 2023/early 2024. If our slowdown scenario is correct, we expect long rates to start falling more sharply towards the end of the year, while corporate profits, still solid at present, are likely to disappoint. This explains our cautious stance on risky assets and our overweighting of long-maturity bonds.
Fig.1 USA: long yields rise again in October despite stabilization of short yields
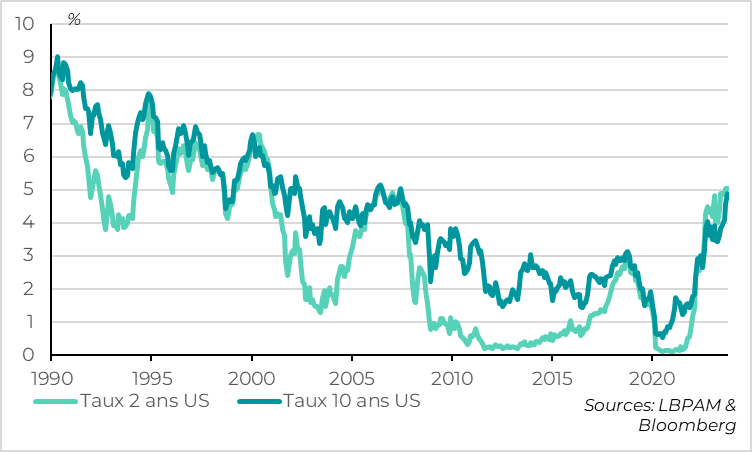
2-year us rate // 10-year us rate
Despite the continuing risks in the Middle East, US 10-year yields ended October up at 4.85% (after touching 5% during the month). And this rise is not due to expectations of higher Fed key rates, since the 2-year rate, which is more closely linked to Fed short-term expectations, stabilized in October after its sharp rise in September. Rather, it stems from the expectation that the Fed may have to keep rates higher for longer, given the still strong momentum of the economy (growth accelerated to more than twice its potential in Q3, at 4.9%) and the term premium demanded by investors in the face of the deluge of US debt issuance.
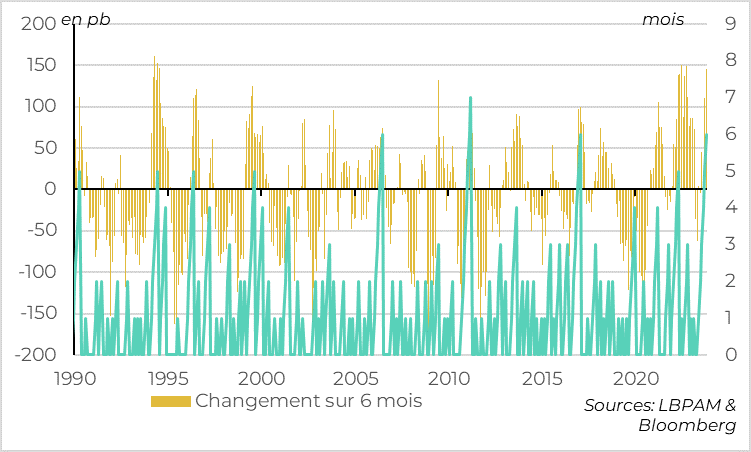 change over 6 months
In a long-term context, the rise in US long rates since the start of the summer is historic. Long rates have been rising uninterruptedly for 6 months, which has only happened once since the early 1980s (in 2011). And the cumulative rise in rates over the last 6 months has reached 145bp, which was exceeded only during the bond shocks of the early 1980s, 87, 94 and 2022.
All in all, not only the high level of long-term rates, but also the speed of their rise, are leading to a historic tightening of financial conditions for the real economy, which is likely to weigh heavily on growth in the coming quarters
Fig.3 USA: the disinversion of the US yield curve is not a good sign for the economic cycle
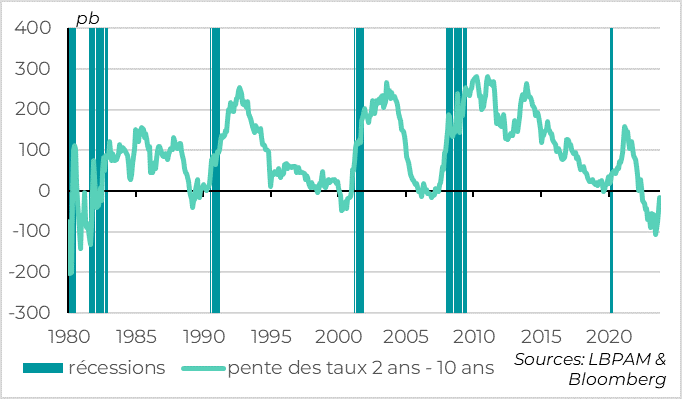
recessions // slope of 2-year-10-year rates
Moreover, US long rates are approaching the level of short rates, whereas they had remained well below them since the Fed began raising key rates in 2022. Now, while the inversion of the US yield curve (i.e. long rates below short rates) is a leading indicator of recession, the time lag between curve inversion and recession is variable and can be long. But it's when the curve begins to invert, as it is now, that the signal of an imminent recession becomes historically important.
And this signal is not only valid when the disinversion comes from falling short-term rates (i.e. when the market anticipates that the Fed will cut rates). Indeed, higher long rates above higher short rates indicate that financial conditions for the economy are becoming very restrictive, increasing the risk of recession.
Fig.4 USA: consumer spending remains buoyant in September 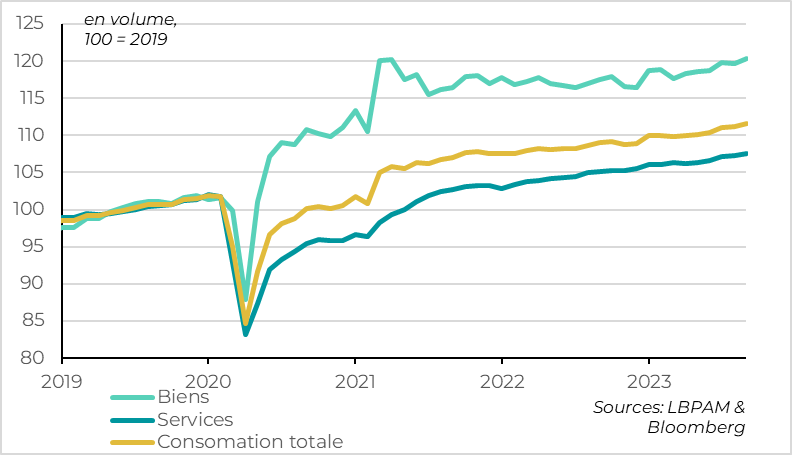
Goods //services // total consumption
Despite these negative signs for the US economic outlook, the latest data continue to indicate that the US economy remains buoyant, driven by consumption. Indeed, consumer spending rose by 0.4% in September, after stabilizing in August (+0.1%). This buoyancy in household demand remains widespread, with an increase in the consumption of both services and goods. Sales of cars, medicines and transport services were particularly strong in September. Given the rise in consumption in the third quarter, growth in Q4 should remain positive. Indeed, even if consumption were to stagnate at September's level over the next three months, Q4 consumption growth would still be over 1% quarter-on-quarter.
Fig.5 United States: consumption financed by a further fall in the savings rate
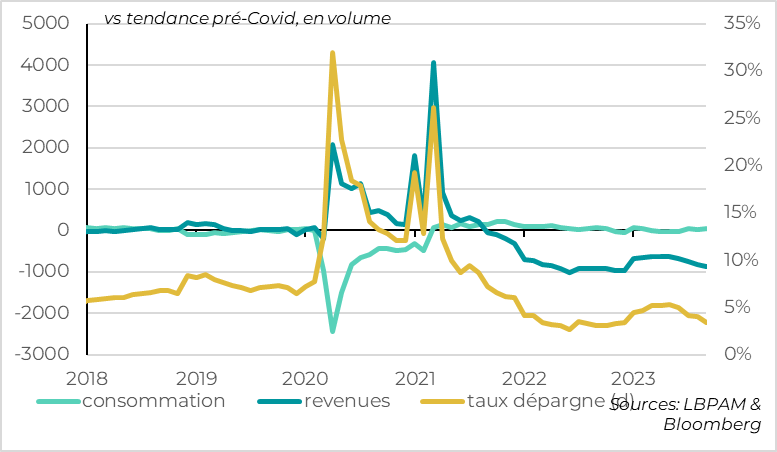
Consumption// income // savings rate
But consumption is being financed by a further fall in the savings rate, which, at 3.4% in September, is the lowest since last year and well below its pre-Covid levels (above 6%). Indeed, despite the rise in wage income, real household disposable income fell for the third consecutive month (-0.1%) due to persistently high inflation and the normalization of taxes. Now that excess savings are concentrated among the wealthiest households, and default rates on consumer credit are rising rapidly, it is hard to believe that households will be able to sustain such high levels of consumption for much longer.
Fig.6 USA: inflationary pressures rebound in September, but remain too high for the Fed to be comfortable
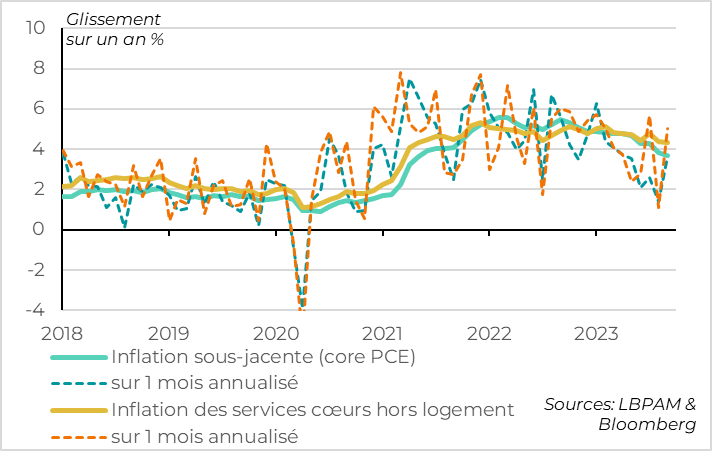
Core inflation (PCE) // over 1 month annualized
Core services inflation, excluding housing //over one month annualized
The consumer price deflator held steady in September at 3.4%, with higher energy prices offsetting a slight drop in core inflation (from 3.8% to 3.7%). But while the Fed's preferred measure of inflation is indeed slowing, it remains almost twice the 2% target, and above all, sequential price momentum picked up in September. The consumer price deflator, excluding food and energy, rose by 0.3% in September, or 3.6% annualized, after slowing below 2% annualized in August. Above all, the price of core services excluding housing, a measure often cited by Powell to reflect domestic pressures, has barely slowed for 6 months and in September remained above 4% year-on-year and above 5% monthly annualized.
Under these conditions, the Fed cannot claim victory on inflation. The figures support our view that, without a sharper slowdown in growth, inflationary pressures will remain above target for the long term. This is why, even if the Fed keeps rates unchanged this week, it should continue to say that it is ready to raise rates further if growth or inflation surprise on the upside again in the coming months.