Who can stop the American consumer?
Link

- The markets are relatively confident ahead of the Fed and ECB meetings next week. Long-term interest rates are still falling after US inflation eased more than expected last week, while the ECB's most hardline members are not committing to any further rate rises after the one expected next week. Risky assets are capitalising on the situation despite the disappointing Chinese data at the start of the week, supported also by the more reassuring initial US corporate results for Q2. That said, the risk appetite seems a little high to us, given that companies could be announcing a more uncertain outlook when they publish their results, which will accelerate over the next few days, while central banks are likely to indicate that they are still a long way from considering rate cuts next week.
- US activity data for June are mixed, but still point to resilient growth thanks to buoyant consumer spending.
- Industrial activity fell more than expected in June. Output fell by 0.5% for the second month in a row – a fall that affects both utilities and manufacturing. While output stabilised in Q2 (+0.2% quarter-on-quarter), it will start the third quarter 0.5% below its average Q2 level. Looking beyond short-term changes, industrial output is falling over 1 year for the first time since the beginning of 2021. This does not mean that US GDP will fall as industry only accounts for 15% of GDP, but it is an indication that the economic cycle is gradually slowing.
- On the contrary, core retail sales, which are used to calculate consumption of goods in GDP, rose by 0.6% after 0.3% in May. This is actually an increase in the volume of sales over the last three months, as the price of core goods was stable during the 2nd quarter. Consumption of goods is therefore picking up as the summer approaches, after slowing at the end of Q1.
- Beyond, the outlook for consumption is positive, albeit limited in our view. On the one hand, the rise in real wages thanks to lower inflation, the stabilisation of the property market and the rise in household wealth argue in favour of continued growth in consumption. On the other hand, as the savings accumulated by households are now spent, restrictive monetary policy should further limit consumption by weighing on job growth and access to credit. The rejection rate for car loan applications hit a 10-year high in June. This will affect the least well-off households, those that have the highest propensity to spend.
-
Overall, we think that consumption will slow to around 1-2% in mid-2023, after growing by more than 4% in Q1. The resilience of consumption, which accounts for 2/3 of US GDP, virtually guarantees that growth will remain positive in Q3 and limits the risk of a sharp recession thereafter. But we still expect activity in the US to slow after the summer, as consumption growth is likely to remain weak while companies are likely to cut back on spending.
Figure 1 : The markets still expect a rate hike next week but no more rate cuts in 2024 .
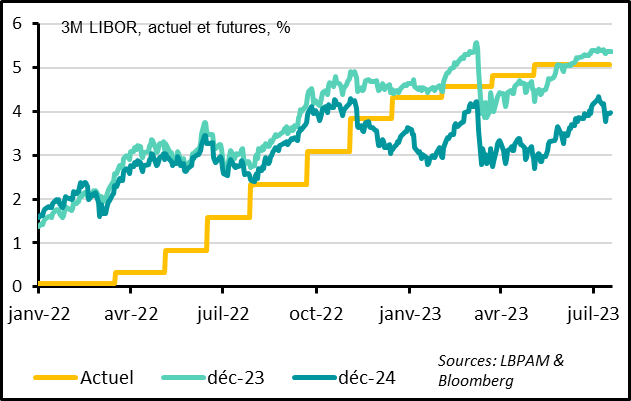
3M LIBOR, current and future%
Current Dec-23 Dec-24
Figure 2 United States: Retail sales rebounded in June
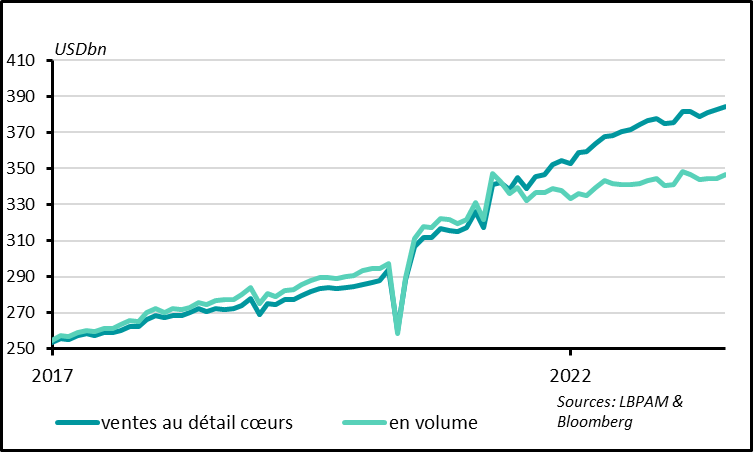
Core retail sales in volume
The consumption of goods is picking up as summer approaches. This is encouraging for continued growth in Q3, as private consumption accounts for 2/3 of US GDP.
Retail sales rose by 0.2% in June after a 0.5% increase in May, broadly in line with expectations. Above all, core sales, those used to calculate the consumption of goods in GDP, rose by 0.6% after 0.3% in May. This is actually an increase in the volume of sales over the last three months, since the price of core goods excluding cars was stable during the 2nd quarter.
Figure 3 United States: Consumption should continue to underpin GDP growth in mid-2023
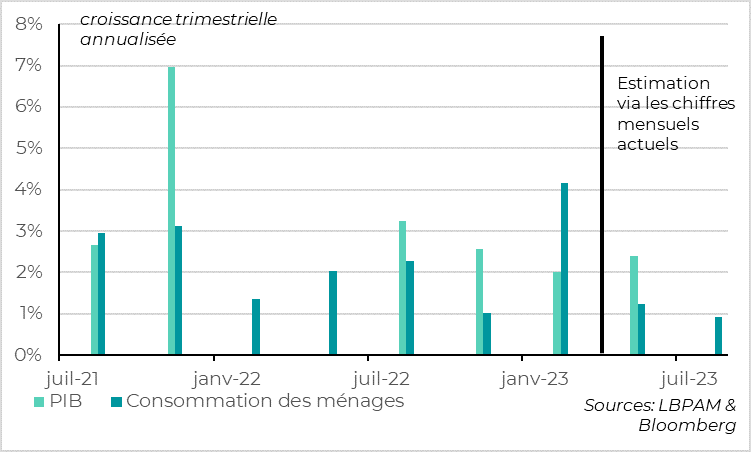
Annualised quarterly growth Estimate based on current monthly figures
GDP/ household consumption
Consumption is set to slow in Q2 after rising by more than 4% on an annualised basis in Q1, as consumption of goods fell in February and March, which would entail an unfavourable base effect. But it should still grow by more than 1% nonetheless, and the base effect for Q3 is very positive. Consumption of goods has actually picked up since April, while consumption of services continues to catch up, although it is still slightly below its pre-COVID trend.
Figure 4 United States: Developer confidence returns to a 1-year high despite the mortgage rates reaching their highest level in 20 years
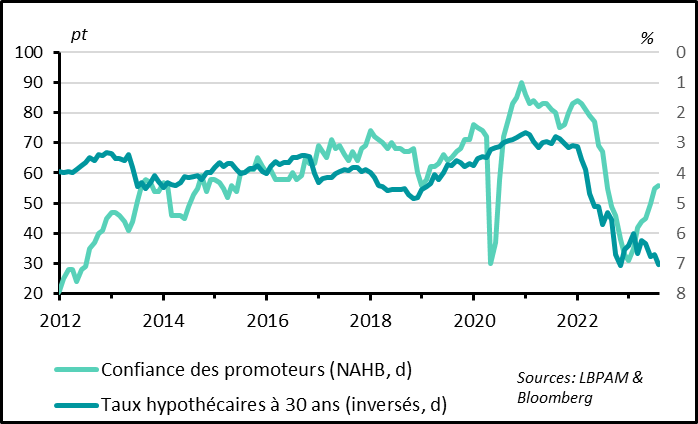
Developer confidence (NAHB, right scale)
30-year mortgage rates (reversed, right scale)
The stabilisation of the property market after its correction in 2022 is being confirmed. It supports the wealth and hence the confidence of US households.
Developer confidence rose slightly again in July, after returning to above its historic average in June. At 56 points, it is at its highest level for a year, despite interest rates returning to their highest level for 20 years. This suggests that the sharp correction in activity (investment reduced by ¼ between early 2021 and early 2023) and the slight correction in prices (-3% between mid-2022 and early 2023) for residential property is now more or less behind us. We nonetheless believe that the property market will stabilise rather than rebound, particularly now that mortgage rates have returned to their levels of the end of last year and the authorities are tightening banking regulation for property loans.
Figure 5 United States: The stabilisation of property prices and a rebound in equities should keep household wealth well above its pre-COVID level
disposable income %
Net wealth of which liquid assets
The stabilisation of house prices, which account for more than a quarter of household wealth, and the 8% rebound in US equities in Q2 are supporting household wealth, which is set to rise in Q2 after 4 quarters of sharp decline, and should therefore remain well above its pre-Covid level. This is a supportive factor for consumption, particularly in the US where wealth effects are particularly important.
Figure 6 United States: But the savings accumulated by households have been spent, which should prevent a further fall in the savings rate
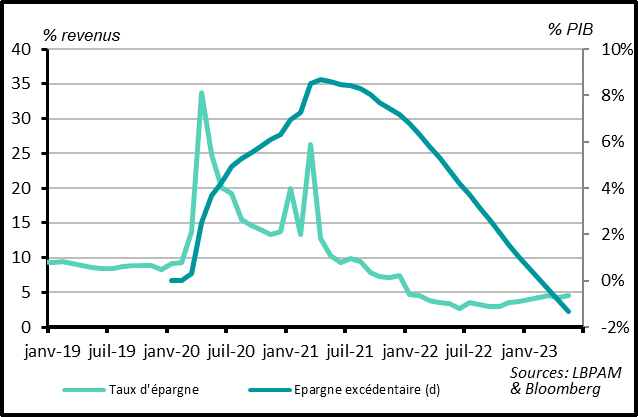
Income % GDP %
Savings rate Surplus savings (right scale)
The savings accumulated by US households during the Covid are now fully spent according to our estimates, however, while the household savings rate remains low, 4 points below its pre-COVID level.
This should prevent a fall in the household savings rate despite the favourable wealth effect, thereby limiting consumption growth in the coming quarters.
Figure 7 United States: Real wages are starting to grow again after 2 years of decline, limiting the risks of a fall in consumption
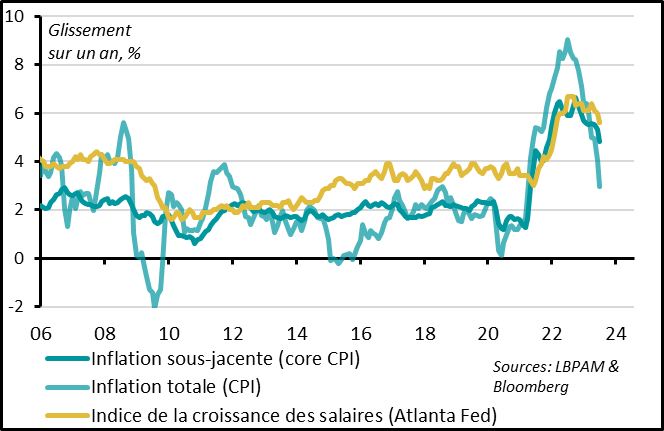
Year-on-year, %
Core inflation (core CPI)
Total inflation (CPI)
Wage growth index (Atlanta Fed)
The faster fall in inflation than the fall in wages has above all enabled real household disposable incomes to start rising again in the last 2 months after almost 2 years of decline. Consumption should thus continue to rise even if the savings rate does not fall and employment growth slows, at least as long as employment does not fall sharply.
Figure 8 United States: But consumer credit conditions are deteriorating which should weigh on consumption by less well-off households
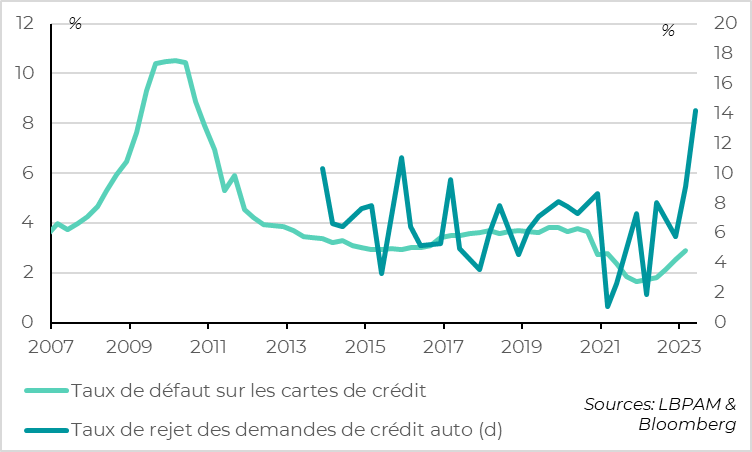
Credit-card default rate
Rejection rate for car loan applications (right scale)
But monetary tightening is beginning to affect households, particularly the less well-off, who have a greater propensity to consume. This can be seen in the normalisation of default rates on consumer credit since the end of 2022, with a marked increase in the amount outstanding. It can also be seen in the rise in consumer credit applications rejected by banks. According to the latest New York Fed survey, the rejection rate for car loan applications was at its highest for at least 10 years in June (14%).
All in all, consumption should hold up over the coming quarters thanks to the rise in real wages and high household wealth, supported by the stabilisation of the property market. Consumption growth is likely to remain limited however because, now that accumulated savings have been used up and fiscal policy is becoming less accommodating (with the end of the moratorium on student loans after the summer), the impact of restrictive monetary policy is likely to be felt more strongly. High interest rates are likely to slow employment further, prevent any real recovery in the property market and weigh on lending, which will penalise particularly households that consume the largest proportion of their income.
Unlike consumption, industrial activity is falling sharply. Industrial output fell by 0.5% in June, following an upwardly revised decline in the previous month (from -0.2% to -0.5%). This decline is affecting utilities as well as manufacturing. While output stabilised in Q2 (+0.2% quarter-on-quarter), it will start the third quarter 0.5% below its average Q2 level. Beyond short-term variations, industrial output is falling over 1 year for the first time since the beginning of 2021.
This reflects the weakness of the international cycle, where manufacturers are avoiding rebuilding stocks in the face of falling demand