The resilience bet
Link

- US equity indices ended the quarter with a bang, with the Nasdaq posting one of its best first-half performances ever. European indices lagged behind in the second quarter but held onto very strong year-to-date gains. Some investors seem to have left Europe to tap into the enthusiasm for US tech stocks, particularly in the hope of big gains from the development of artificial intelligence. The other apparent driver of US markets was greater resiliency in economic activity, given that economic data have come in better than expected since the end of May. The bets are on for longer-lasting resilience in growth. Not only could a more pronounced deceleration in inflation help that along, but the US economy could hold up far better to monetary tightening. Like others and, more importantly, like central banks, we have so far had a hard time anticipating monetary tightening’s effects on demand. These effects may take time to show up, but we are still confident that demand will be contained by past and future key rate hikes by the main central banks. In fact, in our view, the stronger the resilience, the greater the risk that economy will land harder. Nevertheless, given the difficulty of properly estimating trends in demand, we continue to refrain from making extreme allocation bets. Accordingly, we are only slightly underweighting the riskiest assets.
- Keeping track of this economic cycle could be even more challenging as it could be disrupted by unexpected shocks. The current riots in France might be assumed to have a big impact on economic activity. However, at this point and despite very heavy property damage and even the shutdown of some retailing activity, the overall economic impact is likely to be limited, especially if things calm down soon. The longer the crisis lasts, the greater the likely impact on confidence of economic agents and, hence, the greater the possible negative impact on spending behaviour and, hence, on economic activity. But, once again, it is hard to imagine a significant economic impact.
- In the Euro Zone, as expected after the release of figures for major countries, total inflation for June receded to 4.7% year-on-year from 6.1% the previous month. However, and also as expected, core inflation accelerated to 5.4% from 5.3% in May. The small bit of good news is that these figures were a little better than expected. Meanwhile, and reflecting the resilience of demand and the possible persistence of core inflationary pressures, the unemployment rate remained at its historic low of 6.5%. These figures are unlikely to change the ECB’s stance and it will probably stick to its tightening policy in July.
- In Japan, inflation in Tokyo moderated in June, as expected, due to lower energy prices, which rose by 3.1% vs. 3.2% the previous month. Core inflation, i.e., excluding food and energy, also receded slightly but remains well above the target of the Bank of Japan (BoJ), which still expects inflation to rapidly trend towards 2% in the second half of the year. Stubbornly high inflation could also be driven by stronger economic activity, and that is borne out in the Tankan survey for 2Q23, which came in better than expected. If inflation remains high, the Bank of Japan could move sooner than expected to gradually begin at last to tighten its still highly accommodative policy, especially as this policy, which is at odds with those of other major central banks, is keeping the yen very depressed and helping to stoke inflationary pressures.
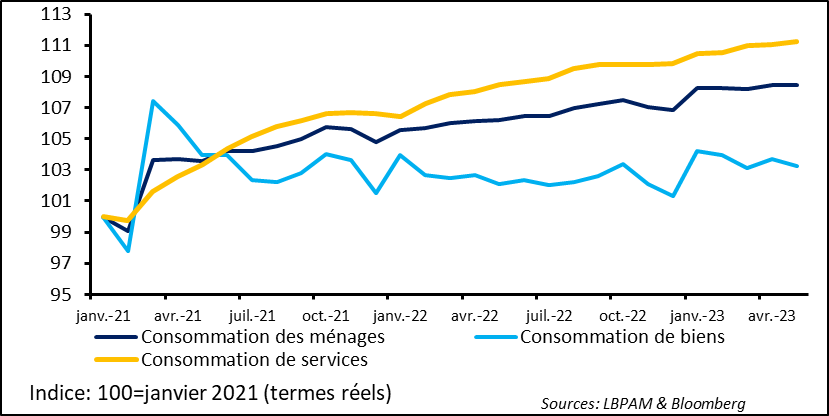
US consumer behaviour is still the keystone of US growth. Figures for May showed that consumption continued to slow after rebounding very sharply in 1Q23. Its increase in real terms was revised to 0.2% for April from 0.5% estimated previously and is thought to have stagnated in May. As a result, and unlike the previous quarter, it was services that drove consumption.
Fig. 1 – US: Consumption looked far less robust in 2Q23 than in 1Q23 but was driven by services.
Jan. Apr. Jul. Oct. …
Household consumption Consumption of services Consumption of goods
Base.100 = January 2021 (in real terms)
Barring a rebound in auto sales in June, among other things, goods consumption could very likely make a negative contribution to the 2Q23 trend in total consumer spending.
Be that as it may, with a job market remaining solid, consumption is likely to continue to hold up. With this in mind, the jobs report late this week should tell us more about the strength of the job market, even though surveys still seem to show strong resilience, particularly in services.
Resilience on the job market, despite monetary tightening, remains one of the factors that is likely to maintain pressure on the Fed, although some monetary policy committee members believe that wage pressures are likely to recede with the further reduction in job offers, which are still running far ahead of job searches.
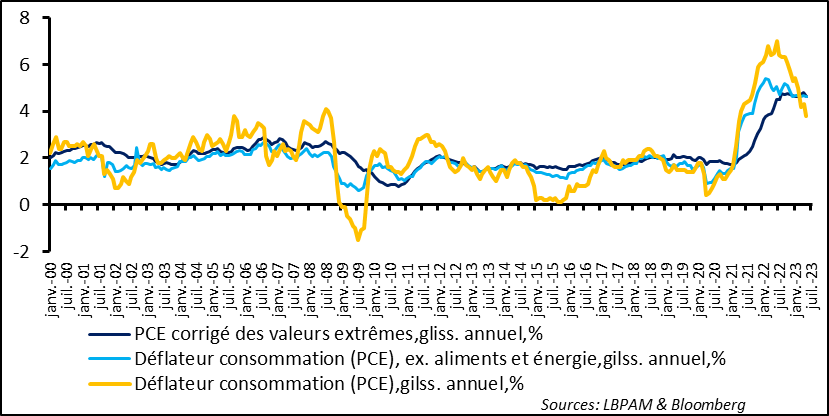
On the inflation front, personal consumption expenditures (PCE), the Fed’s favourite inflation tracker, receded as expected in May, due mostly to falling energy prices. As a result, on a year-on-year basis the deflater fell to 3.8% from 4.3% previously. Given the considerable basis effects caused by energy and commodity prices, this downward trend is likely to continue in the coming months.
However, core inflation, receded only very moderately, to 4.6% from 4.7% in April. In fact, on the year to date, year-on-year core inflation has hovered around these figures. Likewise, trend inflation, i.e., when excluding extreme swings and although it subsided a bit in May, has been above 4.5% since last summer.
Fig. 2 – US: Inflation as measured by personal consumption expenditures (PCE) did recede in May, but core inflation was unchanged on year-on-year basis.
 Jan. Jul. …
PCE adjusted for extreme values, YoY % chg.
PCE consumption deflator ex food and energy, YoY % chg.
PCE consumption deflator, YoY % chg.
Faced with economic figures a little better than expected and the stickiness of inflationary pressures, the bond markets continued to anticipate, as we do, at least one additional Fed key rate hike, in July. However, the risk is still that more tightening will be necessary. This is what seems to be priced into the rise in long-term yields, including 10-year yields that are above 3.8%. The equity markets seem more confident that the Fed will become more accommodating sooner. That is not what we anticipate.
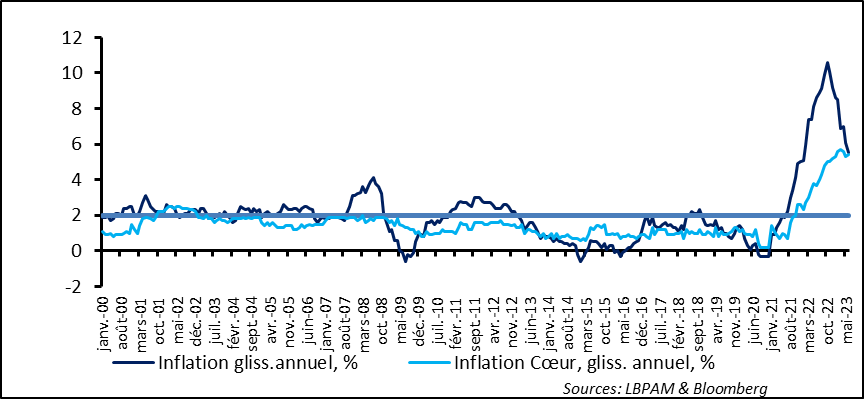
In the Euro Zone, inflation figures confirmed the message sent out in national statistics. For example, total inflation did pull back in June to 5.5% year-on-year, from 6.1% in May. However, core inflation rebounded to 5.4% from 5.3% in May. As we know, this rebound was driven in part by the heavy contribution by German inflation, which was affected by higher transport prices, due to the basis effect created by the flat-rate, ultra-low priced transport pass introduced temporarily last year.
Fig. 3 – Euro Zone: As expected total inflation receded but core inflation remains high
 Jan. Aug. Mar. Oct. May Dec. Jul. Feb. Sept. Apr.
Inflation, YoY % chg. Core inflation, YoY % chg.
Be that as it may, it is clear that disinflation is likely to be a rather slow process, especially as the Euro Zone job market, as in the US, remains very solid, and is thereby keeping wage pressures high. The Euro Zone unemployment rate in May was unchanged, at a historic low of 6.5%.
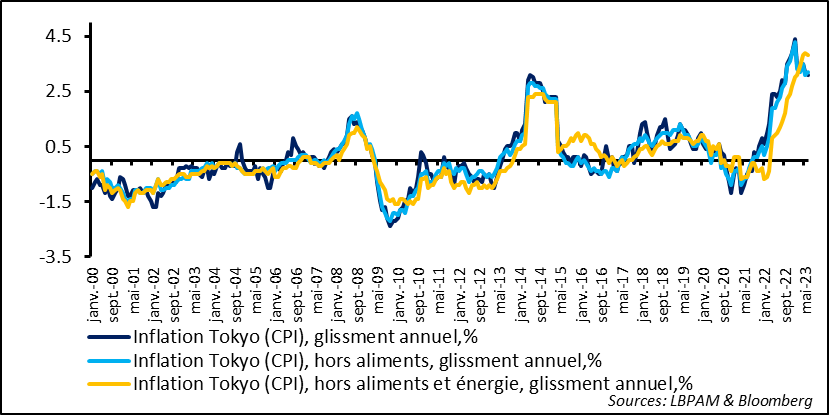
Tokyo inflation figures for June showed that underlying tensions persist, even though total inflation has receded very slightly. Inflation slipped to 3.1% year-on-year from 3.2% the previous month.
Nevertheless, core inflation, i.e., excluding food and energy, shifted a little but did remain very high, at 3.8%.
Fig. 4 – Japan: Inflation driven down by energy prices but core inflation remained high and above the BoJ’s expectations.
 Jan. Sept. May ….
Tokyo inflation (CPI), YoY % chg.
Tokyo inflation (CPI) ex food, YoY % chg.
Tokyo inflation (CPI), ex food and energy YoY % chg.
Although the BoJ’s expectations are still that inflation will recede quickly in 2H23, members of the BoJ’s monetary policy committee seem to be looking more closely than previously at the risks of waiting too long to adjust monetary policy, given trends in core inflation. This seems to be borne out in the release last week of opinions expressed by committee members during their June meeting. That doesn’t mean that a decision is imminent. Kazuo Udea, the new governor of the BoJ, has already stated on several occasions that he wants to be patient. However, persistently high core inflation figures, a falling yen and activity that is recovering, as seems to suggest the latest Tankan survey, could push the BoJ at least slightly into tightening its policy sooner than expected.